Blog
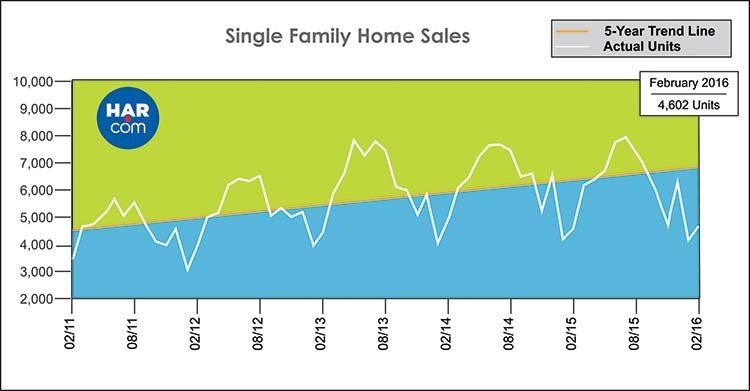
MLS Report for February 2016 THE HOUSTON HOUSING MARKET HOLDS STEADY IN FEBRUARY Homes priced between $150K and $500K performed best HOUSTON — (March 9, 2016) — The Houston real estate market managed to resist most of the effects of the energy downturn in February, with home sales up over two percent compared to the same month last year. Single-family homes priced between $150,000 and $500,000 recorded positive sales volume while the luxury home segment experienced the biggest decline. According to the latest monthly report compiled by the Houston Association of Realtors (HAR), February single-family home sales rose 2.2 percent versus February 2015, with a total of 4,602 sales compared to 4,505 a year earlier. New listings helped inventory grow from a 2.7-months supply to 3.4 months. “So far in 2016, the Houston housing market has remained healthy despite the ongoing strains facing the energy industry,” said HAR Chairman Mario Arriaga with First Group. “Sales are still down in the luxury home market, but, just as we saw in January, mid-range housing performed well and inventory levels grew. There was also a lot of activity among rental properties.” Last week, the Greater Houston Partnership (GHP) reported revised Texas Workforce Commission data showing that the Houston metropolitan area gained 15,200 jobs in 2015, not the 23,200 jobs previously estimated. The GHP report also stated that nearly 51,000 jobs were lost in January, a 1.7 percent decline and slightly above what is considered average for that time of year. The single-family home average price squeezed out a fractional 0.5 percent year-over-year increase, reaching $260,872, the highest figure ever for a February. The median price—the figure at which half of the homes sold for more and half sold for less—was unchanged at $200,000. February sales of all property types in Houston totaled 5,548, statistically flat compared to the same month last year. Total dollar volume for properties sold in February rose 1.2 percent to $1.4 billion. February Monthly Market Comparison Houston’s monthly housing market measurements were largely positive in February compared to those from a year earlier. On a year-over-year basis, single-family homes sales, average price, total dollar volume and inventory levels rose while median sales price was flat. Month-end pending sales for single-family homes totaled 6,801. That is up 1.3 percent compared to last year. Total active listings, or the total number of available properties, at the end of February rose 17.6 percent from February 2015 to 32,914. An increase in new listings in February gave single-family homes inventory a boost, with levels climbing from a 2.7-months supply to 3.4 months. For perspective, the national supply of homes reported by the National Association of Realtors (NAR) currently stands at 4.0 months. CATEGORIES FEBRUARY 2015 FEBRUARY 2016 CHANGE Total property sales 5,538 5,548 0.2% Total dollar volume $1,364,211,035 $1,380,586,269 1.2% Total active listings 27,990 32,914 17.6% Single-family home sales 4,505 4,602 2.2% Single-family average sales price $259,676 $260,872 0.5% Single-family median sales price $200,000 $200,000 0.0% Single-family months inventory* 2.7 3.4 30.5% Single-family pending sales** 6,717 6,801 1.3% * Months inventory estimates the number of months it will take to deplete current active inventory based on the prior 12 months sales activity. This figure is representative of the single-family homes market. ** Effective May 2015, in an effort to be consistent with industry standards, the Houston MLS is now including all categories of pending sales in its reporting. Previously, the Houston MLS did not include “option pending” and “pending continue to show” listings in its reporting of pending sales. The new methodology is now all-inclusive for listings that went under contract during the month. Single-Family Homes Update
Thinking of selling? Now may be the time. Of course, with home prices going down, maybe now is the time for you to buy that dream home that was previously just out of reach! Let us know and one of our agents will get with you to answer any questions. http://www.keepingcurrentmatters.com/…/thinking-of-selling…/
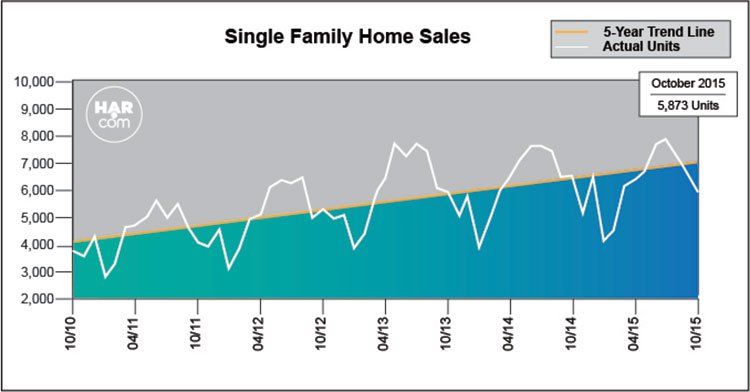
OCTOBER BRINGS ANTICIPATED DECLINE IN HOUSTON HOME SALES Home prices reach October highs despite faltering sales volume HOUSTON — (November 11, 2015) — After performing largely on a par with the record 2014 sales year, the Houston real estate market lost momentum in October as the downturn in the oil industry coupled with the traditional fall season slowdown sent sales into a double-digit decline. According to the latest monthly report prepared by the Houston Association of Realtors (HAR), October single-family home sales dropped 10.2 percent with a total of 5,873 sales compared to 6,541 a year earlier. That marks the fifth time this year that sales have fallen. Declining sales affected homes in all pricing segments. Among those homes that did sell in October, Days on Market (DOM), or the number of days it took for the average home to sell, edged up to 53 days versus 51 in 2014. Slower sales helped boost months of inventory, the estimated time it would take to deplete the current active housing inventory based on sales over the previous 12 months. It rose from a 2.8-months supply last October to a 3.5-months supply. Inventory has now held at a 3.5-months supply for the past four months, but remains below the current national housing supply of 4.8 months of inventory. Home prices climbed to the highest levels ever for an October, with the average price of a single-family home up 3.7 percent year-over-year to $271,648. The median price—the figure at which half the homes sold for more and half for less—jumped 6.6 percent to $205,000. Sales of all property types totaled 7,026 units, down 11.9 percent compared to last October. Total dollar volume fell 8.3 percent to $1.8 billion. “At the beginning of the year, we discussed how Houston home sales would normalize by the end of 2015, and after an impressive run that rivaled last year’s record levels, it looks like the forecast is coming true in the fourth quarter,” said HAR Chair Nancy Furst with Berkshire Hathaway HomeServices Anderson Properties. October Monthly Market Comparison The Houston housing market showed declines in a majority of measurements in the October 2015 versus 2014 analysis, with single-family home sales, total property sales and total dollar volume all down, while prices climbed to record highs for an October. Month-end pending sales for single-family homes totaled 6,374, a 2.7 percent drop from a year earlier, which suggests that slower sales may extend into November. Active listings, or the number of available properties, at the end of October rose 18.9 percent to 33,692. Houston’s housing inventory has held at a 3.5-months supply since July of this year, up from the 2.8-months supply recorded in October 2014. That level still remains below the current 4.8-months national supply of homes reported by the National Association of Realtors (NAR). CATEGORIES OCTOBER 2014 OCTOBER 2015 CHANGE Total property sales 7,993 7,026 -12.1% Total dollar volume $1,987,933,935 $1,823,706,429 -8.3% Total active listings 28,333 33,692 18.9% Single-family home sales 6,541 5,873 -10.2% Single-family average sales price $261,875 $271,648 3.7% Single-family median sales price $192,300 $205,000 6.6% Single-family months inventory* 2.8 3.5 26.0% Single-family pending sales** 6,552 6,374 -2.7% * Months inventory estimates the number of months it will take to deplete current active inventory based on the prior 12 months sales activity. This figure is representative of the single-family homes market. ** Effective May 2015, in an effort to be consistent with industry standards, the Houston MLS is now including all categories of pending sales in its reporting. Previously, the Houston MLS did not include “option pending” and “pending continue to show” listings in its reporting of pending sales. The new methodology is now all-inclusive for listings that went under contract during the month. Single-Family Homes Update
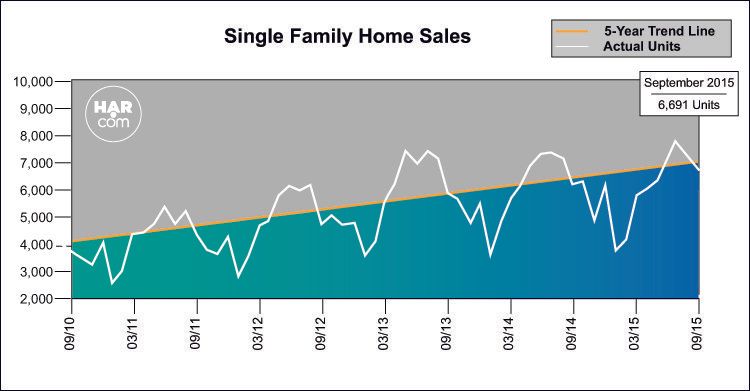
HOUSTON HOME SALES SHOW CONTINUED STRENGTH IN SEPTEMBER Home prices claim September highs while inventory grows HOUSTON — (October 14, 2015) — After a relatively flat performance in August, the Houston housing market kept pace with last year’s record sales volume and prices throughout September. Just as in August, homes priced between $150,000 and $500,000 saw moderate gains, while the low and high ends of the market declined. According to the latest monthly report prepared by the Houston Association of Realtors (HAR), September single-family home sales totaled 6,691 units compared to 6,463 a year earlier, an increase of 3.5 percent. It took 49 days for the average home to sell versus 48 days in 2014. Months of inventory, the estimated time it would take to deplete the current active housing inventory based on sales over the previous 12 months, grew from a 2.9-months supply last September to a 3.5-months supply. Inventory has held at a 3.5-months supply for the past three months, but remains below the current national housing supply of 5.2 months of inventory. Home prices reached September highs, with the average price of a single-family home up 0.5 percent year-over-year to $270,901. The median price—the figure at which half the homes sold for more and half for less—jumped 4.5 percent to $208,000. Sales of all property types totaled 8,024 units, up 2.2 percent compared to September of last year. Total dollar volume rose 3.8 percent to $2.1 billion. “September showed a bit more vitality than August, and considering that we are comparing to a record 2014 sales year and remain in a climate of energy-related layoffs, I’d say that the Houston real estate market is truly holding its own,” said HAR Chair Nancy Furst with Berkshire Hathaway HomeServices Anderson Properties. “Sales inventory has been stable for the past three months and we expect it to grow in the last quarter of 2015.” September Monthly Market Comparison The Houston housing market saw across-the-board gains in the September 2015 versus 2014 analysis, with single-family home sales, total property sales and total dollar volume all up, while prices reached record highs for a September. Month-end pending sales for single-family homes totaled 6,602, a 3.7 percent decline from a year earlier, which might suggest slower sales when the October numbers are tallied. Active listings, or the number of available properties, at the end of September rose 17.6 percent to 34,041. Houston’s housing inventory has held at a 3.5-months supply since July of this year, but is up from the 2.9-months supply recorded in September 2014. That still remains below the current 5.2-months national supply of homes reported by the National Association of Realtors (NAR). CATEGORIES SEPTEMBER 2014 SEPTEMBER 2015 CHANGE Total property sales 7,848 8,024 2.2% Total dollar volume $2,002,031,499 $2,078,301,152 3.8% Total active listings 28,946 34,041 17.6% Single-family home sales 6,463 6,691 3.5% Single-family average sales price $269,629 $270,901 0.5% Single-family median sales price $199,000 $208,000 4.5% Single-family months inventory* 2.9 3.5 20.7% Single-family pending sales** 6,854 6,602 -3.7% * Months inventory estimates the number of months it will take to deplete current active inventory based on the prior 12 months sales activity. This figure is representative of the single-family homes market. ** Effective May 2015, in an effort to be consistent with industry standards, the Houston MLS is now including all categories of pending sales in its reporting. Previously, the Houston MLS did not include “option pending” and “pending continue to show” listings in its reporting of pending sales. The new methodology is now all-inclusive for listings that went under contract during the month. Single-Family Homes Update
With the new site live, we hope everyone can easily navigate the page. Please let us know if there are any issues!